Probing the Pattern of Price Changes: An Update
As I discussed in an April Economic Brief article and an August Macro Minute post, during the period of stable inflation from January 1995 to February 2020, the monthly inflation rate moved systematically with the share of relative price increases.1 This relationship was maintained in the first year of COVID-19, but starting in the spring of 2021 and continuing into the beginning of 2023, inflation was consistently higher than would have been expected based on each month's share of relative price increases. The August post reported on data through June of this year, finding tentative signs of the pre-COVID-19 relationship between inflation and the share of relative price increases reemerging. In this post, I provide an update based on the most recent four months of data, covering July through October.
Intuition for the relationship between inflation and the share of relative price increases is straightforward: Even when inflation is generally stable, there can still be shocks that cause large changes in the relative prices of particular categories of goods and services. Monthly inflation moves up and down in part because of these shocks, and the share of relative price increases is a summary statistic for the manifestation of those shocks in large relative price changes.
A typical example is gasoline. If the price of gasoline moves up dramatically and other prices behave normally, then not only will inflation be high, but the share of relative price increases will be low. In the extreme case where all other prices were unchanged, gasoline would be the only consumption category with a relative price increase.
Turning to the data, Figure 1 below plots the 36 months from March 2020 to February 2023, distinguishing three consecutive 12-month periods. The monthly inflation rate is on the vertical axis, and the monthly share of relative price increases is on the horizontal axis. For reference, the black solid line is the predicted inflation rate based on pre-COVID-19 data (January 1995 to February 2020), and the dashed lines represent the two-standard-deviation prediction interval, with each of those lines based on local polynomial regressions.
The data obeyed the pre-COVID-19 relationship from March 2020 to February 2021, but inflation in the next 24 months was consistently higher than the pre-COVID-19 relationship would imply, conditional on the share of relative price increases.
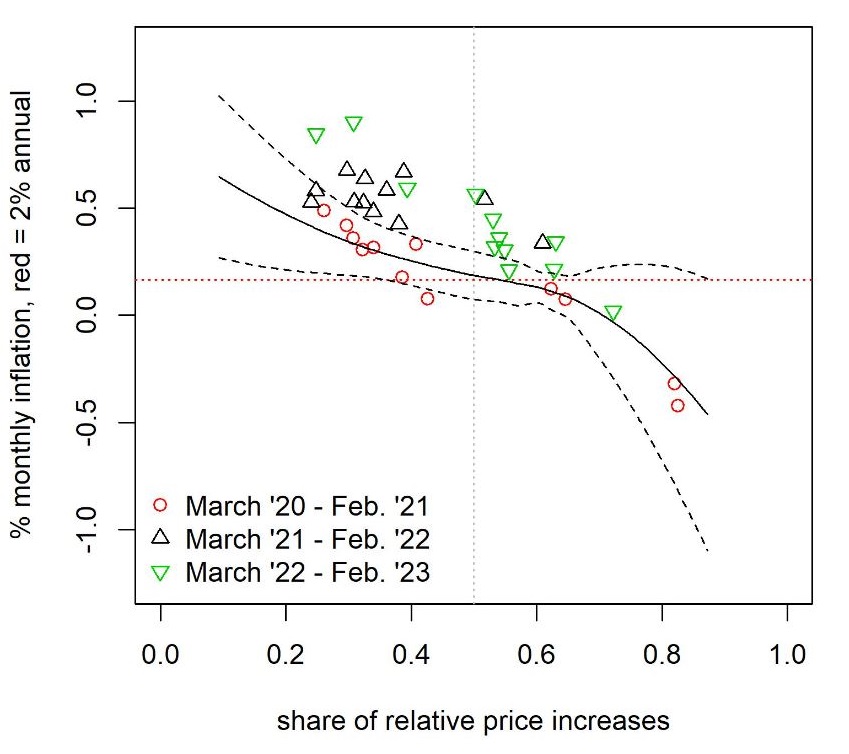
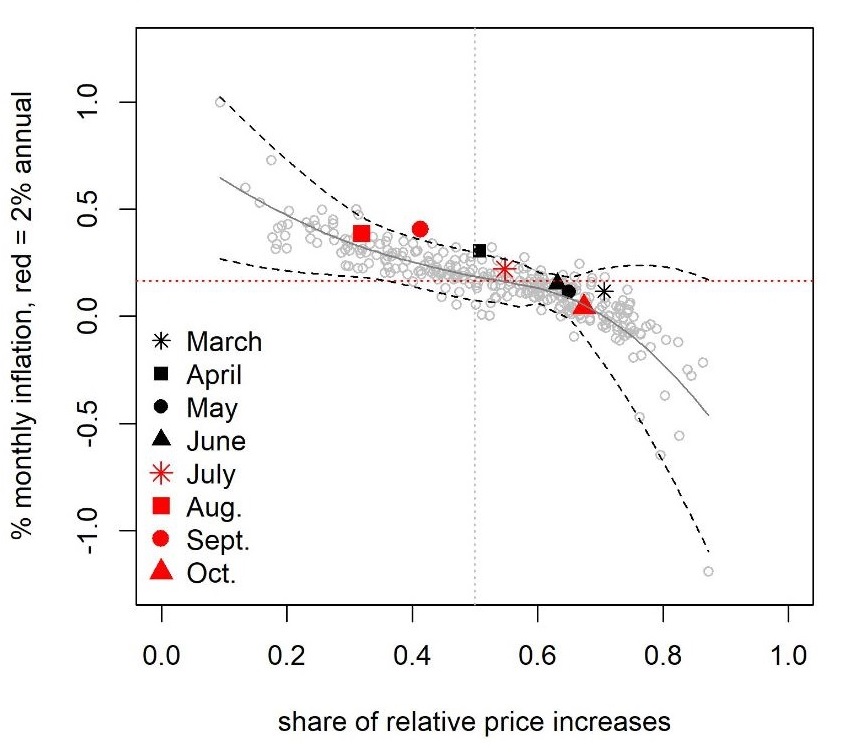
Figure 2 below keeps the predicted inflation rate and interval from Figure 1 and plots the most recent eight months of data (March 2023 to October 2023). In addition to the pre-COVID-19 prediction interval, it also plots the pre-COVID-19 data as gray circles. Inflation over the last eight months has been higher than would have been predicted from the share of relative price increases, using the pre-COVID-19 relationship between those variables. However, in six out of the eight months, inflation has been well within the prediction interval.
Even when monetary policy has succeeded in stabilizing inflation, the monthly inflation rate fluctuates. In real time, one can never be certain that the data are consistent with the desired stable-inflation regime. In retrospect, we can see that inflation was stable from 1995 to 2020, and one manifestation of that stability is the systematic relationship between the monthly inflation rate and the share of relative price increases. Figure 1 showed that the high inflation of 2021 and 2022 coincided with a breakdown of inflation's relationship to the share of relative price increases. Figure 2 showed that the pre-COVID-19 relationship has come close to reappearing in recent months. Inflation is still above the Fed's target, but the recent deviations from target have been close to what one would expect when the Fed has effectively stabilized inflation around its target.
Macro Minute will be on hiatus during the holiday season and will resume Jan. 9. Have a safe and wonderful holiday season!
The share of relative price increases is a statistic from the cross-sectional distribution of relative price changes. It is calculated each month by arranging all the categories of personal consumption expenditure in order of their price change, then adding up the expenditure shares of all categories with price increases greater than that month's PCE inflation rate.
Views expressed in this article are those of the author and not necessarily those of the Federal Reserve Bank of Richmond or the Federal Reserve System.